


Curious why the market turned? Check out what BCREA’s research showed!
Jul 9, 2019
July 2019 | from BCREA
Curious why the market turned? Check out what BCREA’s research showed!
"Without the stress test, home sales in BC would have been about 7,500 sales—or 10% higher—in 2018; and approximately $500 million in BC economic activity was lost due the B20 stress test.”
The Impact of the B20 Stress Test on BC Home Sales in 2018 Summary Findings:
- The decline in home sales in 2018 was largely due to market factors like interest rates and affordability
- Without the stress test, home sales in BC would have been about 7,500 sales—or 10% higher—in 2018
- Approximately $500 million in BC economic activity was lost due the B20 stress test
Home sales across Canada plummeted to start 2018. The near-coincident implementation of several new federal and provincial housing policies designed to temper BC housing demand has given rise to competing explanations for what ultimately caused the downturn. Was it the B20
mortgage stress test? Higher interest rates? The provincial speculation tax or the expansion of the foreign buyers’ tax?
In this Market Intelligence, we will attempt to provide some insight into the causes of the 2018 housing market slowdown.
Isolating the Impact of the B20 Mortgage Stress Test
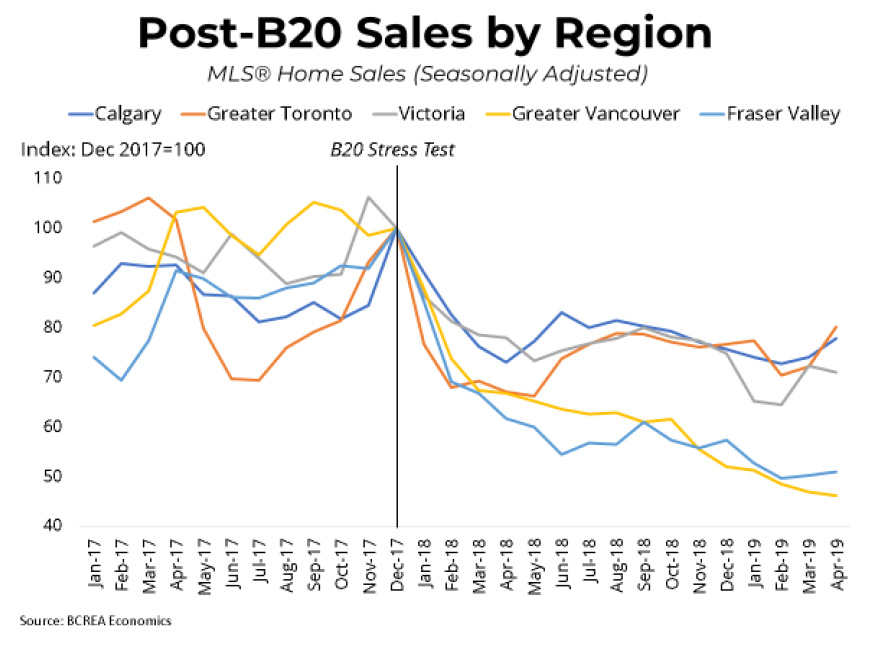
The coordinated decline in Canadian home sales, which began immediately after the implementation of B20, makes that policy a natural place to look as we investigate 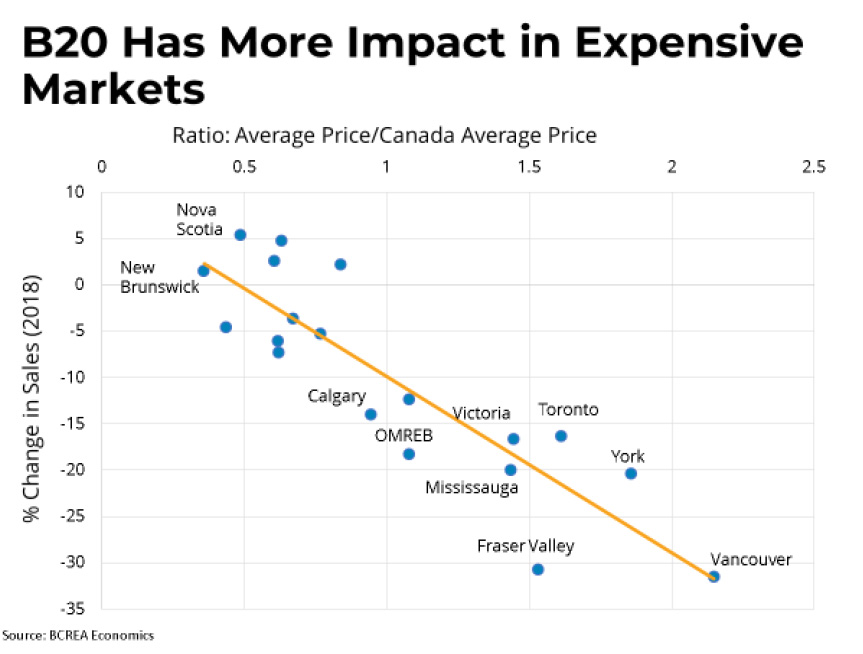 the cause of the housing downturn. The fact that so many Canadian markets saw home sales drop sharply to start 2018 indicates a common factor driving that decline.
Many markets in BC experienced a much deeper and more prolonged decline in home sales than in other Canadian markets, perhaps pointing to provincial polices weighing down sales over and above the impact of the stress test alone. However, when we look at markets across Canada, it appears that the outsized decline in BC may have more to do with relatively stretched affordability in BC compared to the rest of the country. Expensive markets in other areas, most notably those near Toronto, also experienced significant declines in 2018.
 Methodology
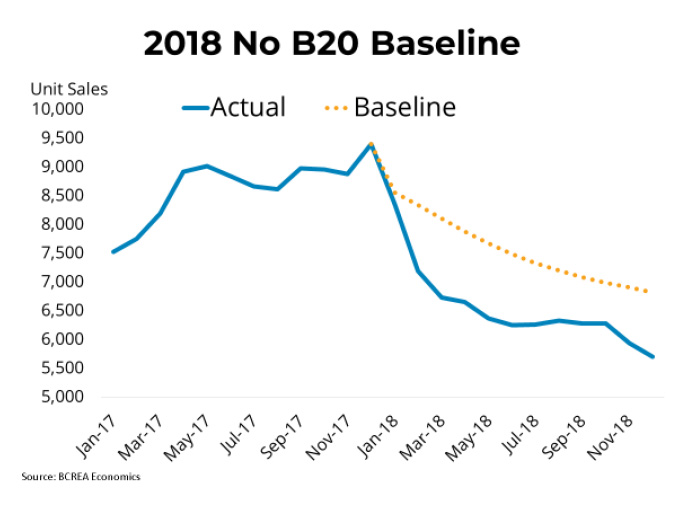
The ideal way to identify causation in economics is to use a controlled experiment, in which impacts can be compared between a test group subject to the new policy and a control group that is not. Unfortunately, such experiments in macroeconomics are rare. Since B20 applies across all Canadian markets, we do not have a suitable control group to use as a baseline for comparison. As a next best solution, we can instead use econometric modelling to estimate a baseline of home sales if the stress test had not been implemented.
Using BCREA’s workhorse forecasting model(i), we estimate a 2018 baseline of BC home sales of 90,500 units, a decline of roughly 11,000 units from 2017. This decline was driven by market 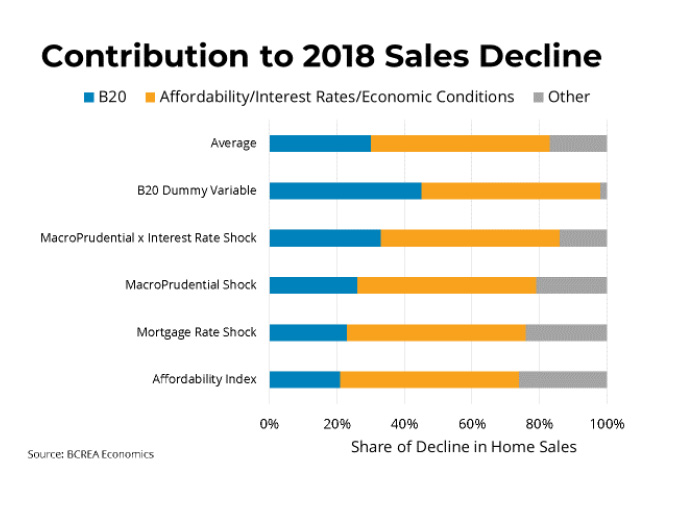 forces such as rising interest rates, deteriorating affordability and a slowing economy. Given that home sales in 2018 were 78,346, this means that factors outside of those explicitly controlled for in the model need to explain about 13,400 additional lost sales.
Isolating the share of sales lost due to the stress test is a challenging task. To do so, we employed both our own forecasting model and a model of sales fundamentals developed by the Bank of Canada(ii). Specifically, we tried to isolate the impact of the stress test using 5 different shock specifications. These include incorporating B20 as a shock to an affordability index, a shock to the cost of borrowing, a policy dummy variable and a shock to a macroprudential
policy index(iii) both by itself and interacted with mortgage rates(iv). We then compared dynamic simulations from these models to our estimated baseline.
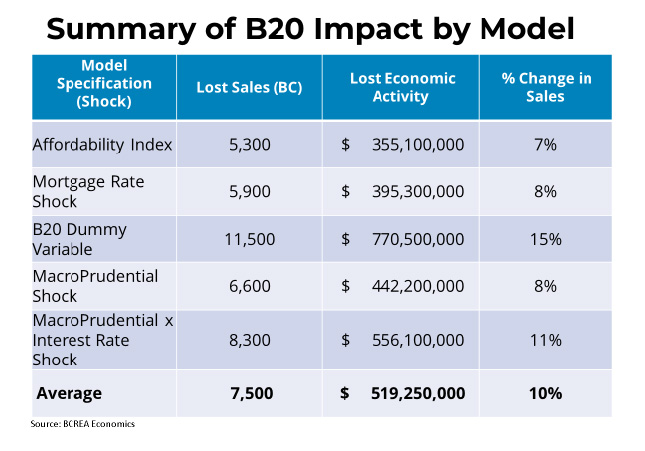 We estimate the lost sales due to B20 in 2018 to be a range of 5,300 to 11,500 units, with an average of 7,500 units. On average, we estimate that B20 accounted for about 30% of the total downturn in BC home sales observed in 2018 and cost the province approximately $500 million in spin-off activity related to MLS® home sales(v).
Notes and References:
i BCREA’s workhorse forecasting model uses a vector error-correction framework in which sales,
listings and prices are determined jointly based on a long-run equilibrium relationship and changes
in other factors such as interest rates and employment growth.
ii Taylor Webley, “Fundamental Drivers of Existing Home Sales in Canada,” Bank of Canada Staff
Discussion Paper, December 2018.
iii This index was constructed based on the IMF’s integrated Macroprudential Policy (iMaPP) database,
found here.
iv The methodology here is similar to Aastveit et al., “Economic uncertainty and the effectiveness of
monetary policy,” Norges Bank Research Working Paper, June 2013.
v Lost economic activity is derived from estimates of spin-off activity resulting from each MLS sale, found
here.